IN A NUTSHELL
About This Work
The phages used for phage therapy are Caudovirales, conforming to a blue-print where the virion consists of an icosahedral protein capsid that houses the phage genome, and a multicomponent tail. These tails can be long and contractile, long and non-contractile or very short, and in all cases the function of this tail machinery is complex. First and foremost, elements within the tail function to engage a species-specific component on the surface of the host bacterium, thereby initiating the infection cascade. The tail machinery is also responsible for penetrating through the bacterial cell wall, in order that the tip of the tail can enter the bacterial cytoplasm. Depending on the phage type, these could include contraction-inducing elements that physically breach the bacterial envelope or enzymatic functions that locally hydrolyze each of the distinct layers of the bacterial envelope. Then, and only then, is a signal transmitted to the portal at the proximal end of the tail, enabling release of the phage DNA into the tail lumen to permit DNA translocation into the host cell cytoplasm. Understanding how a phage recognizes and infects a bacterial host requires an understanding of each of these component parts.
Given that successful phage therapy protocols require diverse phage in a phage cocktail, with the need to recognize features of diverse phage from under-sampled environments, we have developed an ensemble predictor (termed STEP3) to accurately call phage virion proteins, and visualize their potential subtypes based on sequence similarity and phylogenetic considerations. STEP3 investigated different types of evolutionary features, extracted from the Position-Specific Scoring Matrix (PSSM), to track the evolutionary history of proteins. Considering the high evolution rates of phage proteins, these features are particularly suitable to detect novel virion proteins with only distantly related homologies. STEP3 further integrated these features into an ensemble framework to achieve a stable and robust prediction performance. The final ensemble model showed a significant improvement in terms of prediction accuracy over current state-of-the-art phage virion protein predictors on extensive 5-fold cross-validation and independent tests.
ARCHITECTURE
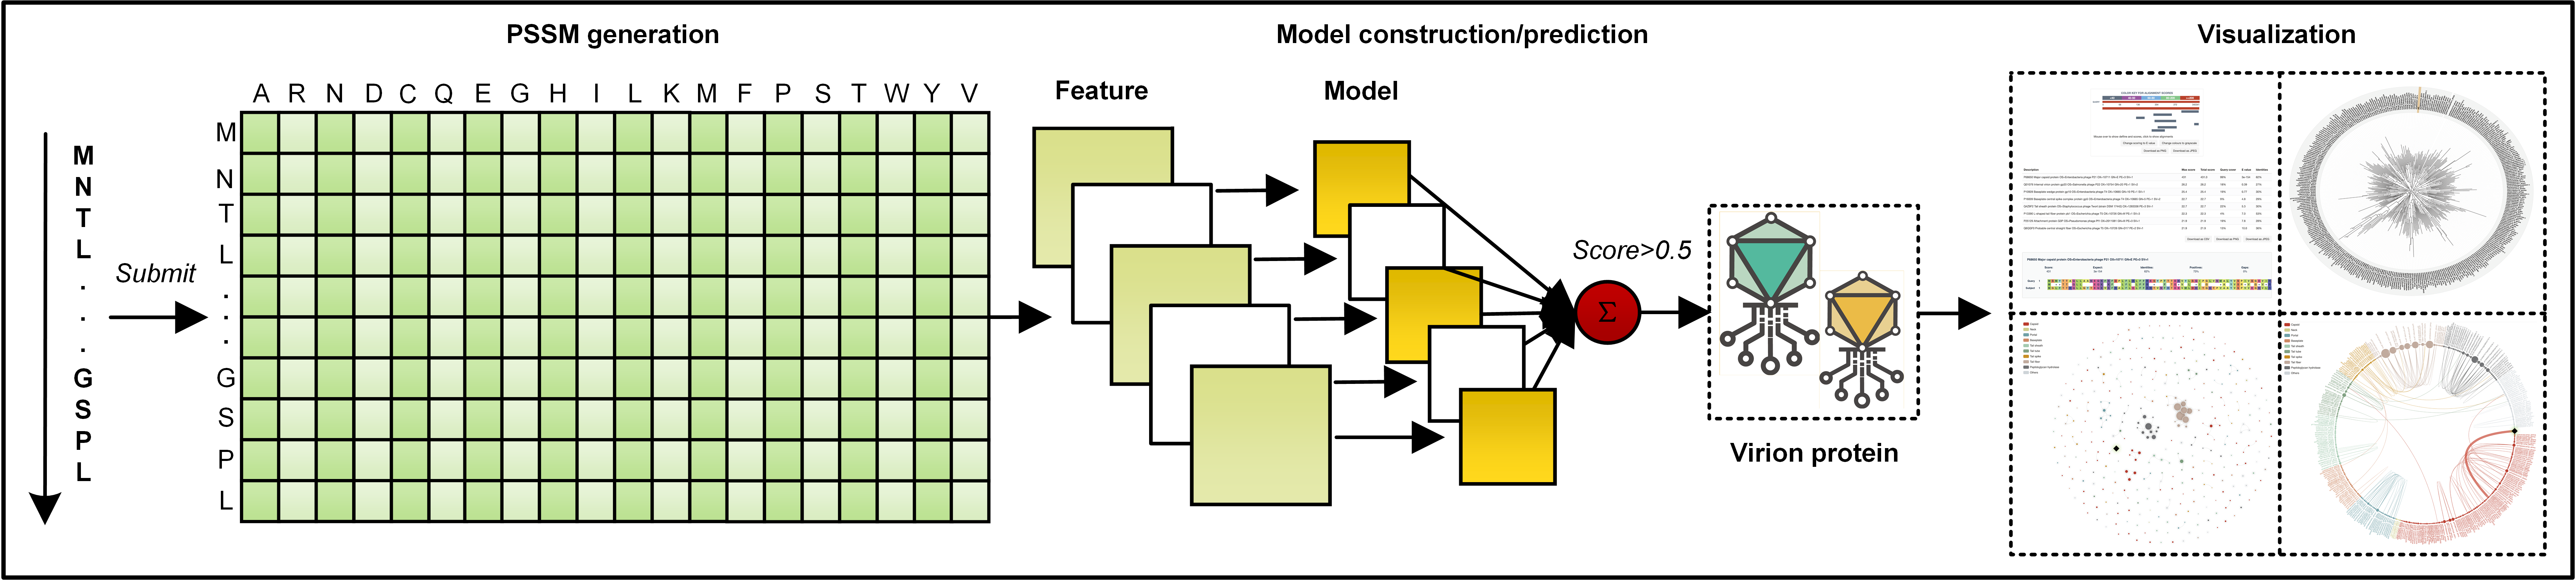
The overall workflow of STEP3 is presented in the way how we collected and curated the datasets, encoded features, trained and integrated models, evaluated model performance, and developed the toolkit.
1. Dataset
There were 481 phage virion proteins (PVPs) that had been experimentally verified. These PVPs were collected from the UniProt (i.e. proteins tagged as 'reviewed') and NCBI databases. Redundant sequences were removed using the CD-HIT program at a cut-off threshold of 0.4. As a result, 339 PVPs with less than 40% sequence similarity were obtained. These proteins were further divided into two positive sample datasets: 243 for the training dataset and 96 for the independent dataset. For the negative sample dataset, 790 phage non-virion proteins with less than 40% sequence similarity were collected from UniProt and divided into two negative sample datasets: 694 for the training dataset and 96 for the independent dataset. Finally, a training dataset (comprising 243 positive samples and 694 negative samples) and an independent dataset (comprising 96 positive samples and 96 negative samples) were obtained. The two newly sequenced phage genomes MEW1 and MEW6 were subsequently used to validate the prediction capability of STEP3 after identifying the PVPs by mass spectrometry phage virions.
2. Feature Encoding
Instead of extracting features directly from the protein sequences, evolutionary features mine patterns from a more informative profile in the format of PSSM. To generate a PSSM, the blast-2.2.26 was used to search the protein sequence against the UniRef50 dataset with the E-value set to 0.001 and the iteration number set to 3. Five types of evolutionary features were generated using the POSSUM tookit, including AAC-PSSM, PSSM-composition, DPC-PSSM, AADP-PSSM, and MEDP. Additionally, four commonly used features were additionally implemented for comparison purpose, including the amino acid composition (AAC), dipeptide composition (DPC), QSOrder and PAAC. AAC and DPC count the frequencies of residues and dipeptides in a protein sequence, respectively. QSOrder and PAAC extract features from a protein sequence as well, incorporate the physicochemical properties of its individual amino acids.
3. Model Construction
Our imbalanced training dataset is to reflect the fact where the number of virion proteins is usually larger than that of the non-virion proteins in a phage isolate. To train the model upon the imbalanced dataset, we randomly selected the same number of non-virion proteins and combine them with the virion proteins to generate a new balanced subset. This procedure was repeated five times, to generate five balanced subsets. For each feature, five individual models were trained based on five balanced subsets, and their prediction scores were averaged to obtain an ensemble model as the baseline model. Finally, five baseline models (corresponding to five evolutionary features) were further integrated as the final ensemble model of STEP3 through averaging their prediction scores. Support vector machine (SVM) with a radial basis function kernel was used to train each model, implemented by the e1071 package in the R language. The two parameters of SVM, including the Cost and Gamma, were optimized by a grid search between 2-10 and 210 with a step of 21 using the same R package.
4. Performance Evaluation
The STEP3 predictor was extensively validated, with the baseline models and existing state-of-the-art tools on the 5-fold cross-validation and independent tests. Five performance metrics were used, including Sensitivity (SN), Specificity (SP), Accuracy (ACC), F-value and Matthews correlation coefficient (MCC). For each model, 5-fold cross-validation tests were conducted 5 times based on 5 balanced training datasets, and then the performance metrics were averaged as the final performance on the 5-fold cross-validation test.
5. Server Construction and usage
The STEP3 server contains a client web interface and a server backend. The client web interface was implemented by the JAVA server development suite, JSP, CSS, jQuery, Bootstrap and their extension packages. The server backend was used by the Perl CGI. For visualization purpose, the blast 2.8.1+ was used to search each predicted virion protein against known virion proteins to generate sequence similarities, which was visualized by BlasterJS. The MAFFT v7.271 was used to generate multiple alignment results between each predicted virion protein and known virion proteins, which was visualized by jsPhyloSVG. A queuing system was implemented using the Gearman framework to store the jobs the client deposits and dispatch them to idle threads maintained in the server backend. In this way, it links the two parts of STEP3, but decouples the prompt-response required client web interface and the time-consuming server backend for better user experience. To use the STEP3 server, users submit their protein sequences in FASTA format, and obtain a unique link to track the prediction progress or obtain the results once finished. In default mode, i.e. 'For normal use', the known virion proteins were marked with 'exp.' with an external link to the UniProt or NCBI database, while the predicted virion proteins were marked with 'pred.' with detailed annotations and options for visualization. Through interactive visualization, users could tentatively annotate the putative virion proteins with their potential subtype or functions, based on the sequence similarity or phylogenetic analysis considerations. For users who want to benchmark the STEP3 server, a 'For benchmarking test' option is available to obtain prediction scores for all their sequences.
ONLINE WEB SERVER
1. STEP3
To maximize user convenience, particularly for the amenability of biomedical scientists and biotechnologists, this user-friendly and publicly accessible web server has been established for the wider research community to perform predictions of novel putative PVPs from phage genome-scale sequences (in format of protein sequences). STEP3 is a universal toolkit for predicting PVPs, with an extended visualization to infer their possible subtypes based on the sequence similarity and phylogenetic analysis, freely accessible at http://Step3.erc.monash.edu/.
1.1 Important settings of the STEP3 server
- PSSM-based features generated by STEP3 is based on PSSM profiles, which are obtained by searching each target protein sequence against the uniref50 database;
- The ensemble model currently used in the STEP3 server is trained based on the training dataset in line with its paper. It will be updated by combining all the experimentally PVPs as the positive dataset to retrain the prediction model. This operation would be continuously conducted through the retrieval of new experimentally validated PVPs on a regular basis.
2. Using the STEP3 web server
Navigate to the STEP3 prediction page by selecting 'Server' in the navigation menu or 'Go to use it! >' at the home page.
2.1 Input Formats
Two types of input are accepted by STEP3: sequences in FASTA format (strongly recommended) and raw sequences. You can upload a file in FASTA format with your sequences, or insert them manually into the text box. For this tutorial, we will use the 'example' list of 7 proteins. Click the example button and then submit.
In the case of input sequences in the FASTA format, you can prepare and input them as follows:
In addition, the following input sequence, which is in the original format downloadable from the UniProt database:
TVKLTHEDWFGYDLDQFDMDENGAYTVENVVREHNKMITIPHRDKVAVQKLFDSAAKKATDSITKDNALDAYDTAEAYMFDNEVPGGFVMFVSSAYYTALKQSAAVTRTFSTDGTMAINGIDRRVAQLDGGVPIVRVSSDRLKGLGITDHVNFILTPLSAIAPIVKYDSVSVIDPSTDRSGNRWTIKGLSYYDAIVLDNAKKGIYVAATAGA >MEW1_03 - 1875: 2294 MW: 15401.713 MNITDEVITDFRMWSGGMGIFGDAVKFPDALVQYALCRGDVATGSRRWGGYQSDCHSNKMVGMFLYAAAWLSM YYPDGTGGDVNTEARLNVASKSVGDESIVYRVPQMMEVNNDFLTYTVFGQEFYSLRKKIGMGALAV
will be formatted (in order to remove those line breaks within the sequence) as follows:
In the case of raw sequences, you can input them as follows:
which will be formated by STEP3 as follows:
2.2 Input sequence limits
- Each sequence should have between 20 and 5000 amino acids.
- You can input up to 5000 sequences at once.
3. STEP3 Prediction Result Instructions
STEP3 contains a built-in list (continuously updated to keep in pace with new experimentally validated PVPs) of PVPs, as to annotate the prediction results after jobs are processed, through which we aim to distinguish the known PVPs from the computationally predicted ones.
For a known PVPs, the results are marked as Exp. (an example is provided in the following figure).
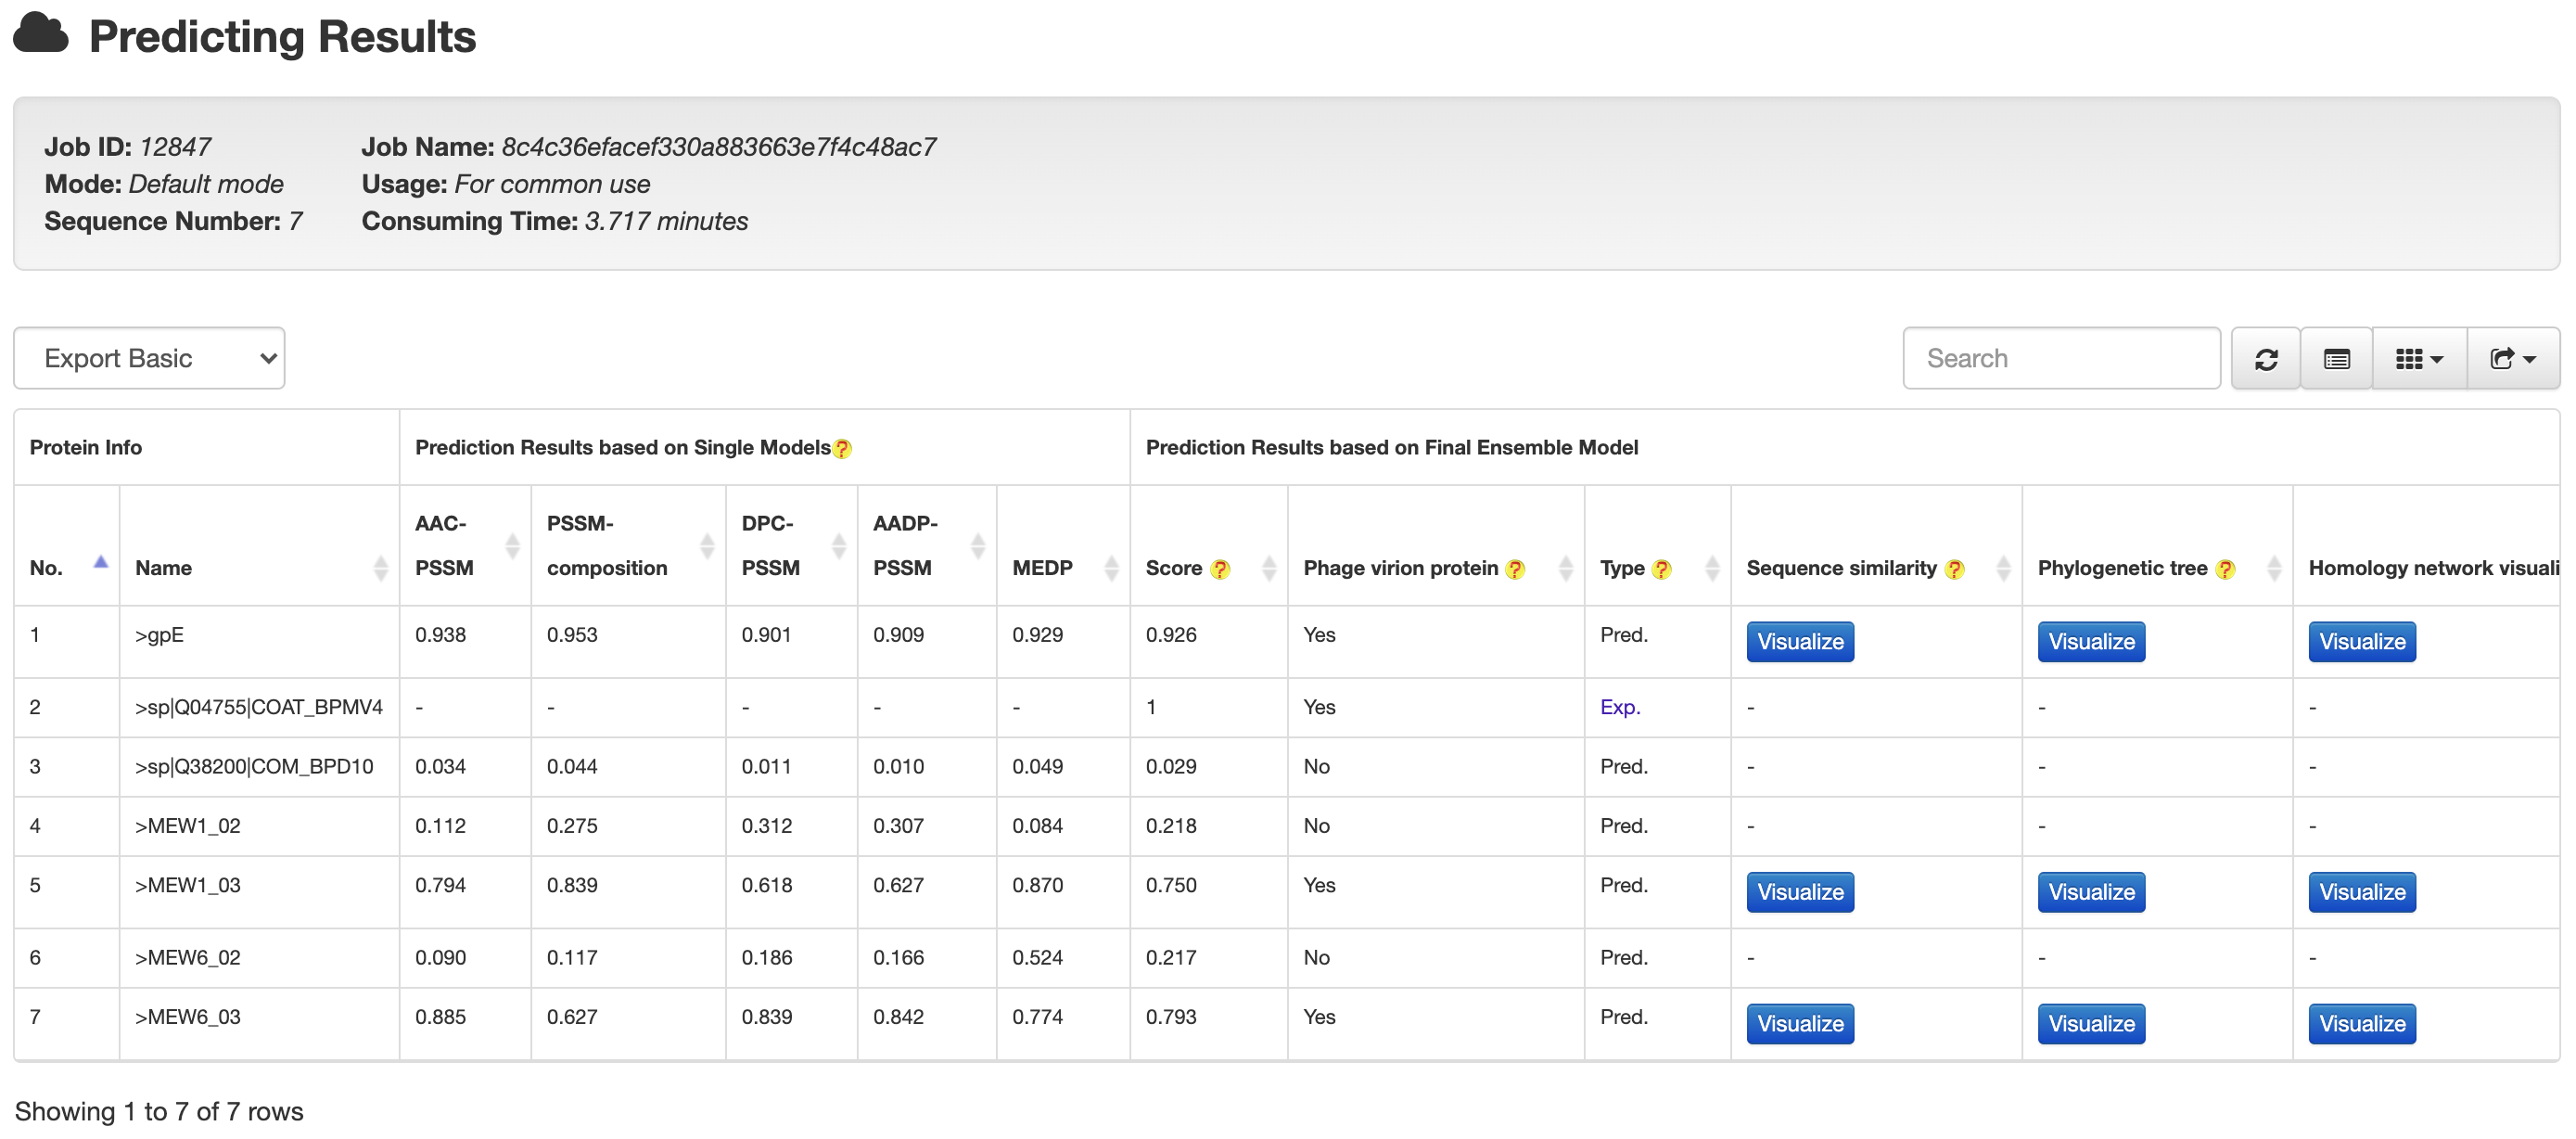
For a computationally predicted protein (PVP or non-PVP), the results are marked as Pred., while the detailed prediction results (including those predicted by the single method-based models and those predicted by the final ensemble model) will also be presented to users.To ease downstream analysis, each predicted PVP will be visualized in the format of sequence similarity and phylogenetic relationship with all known PVPs for users to infer its possible subtypes or functions.
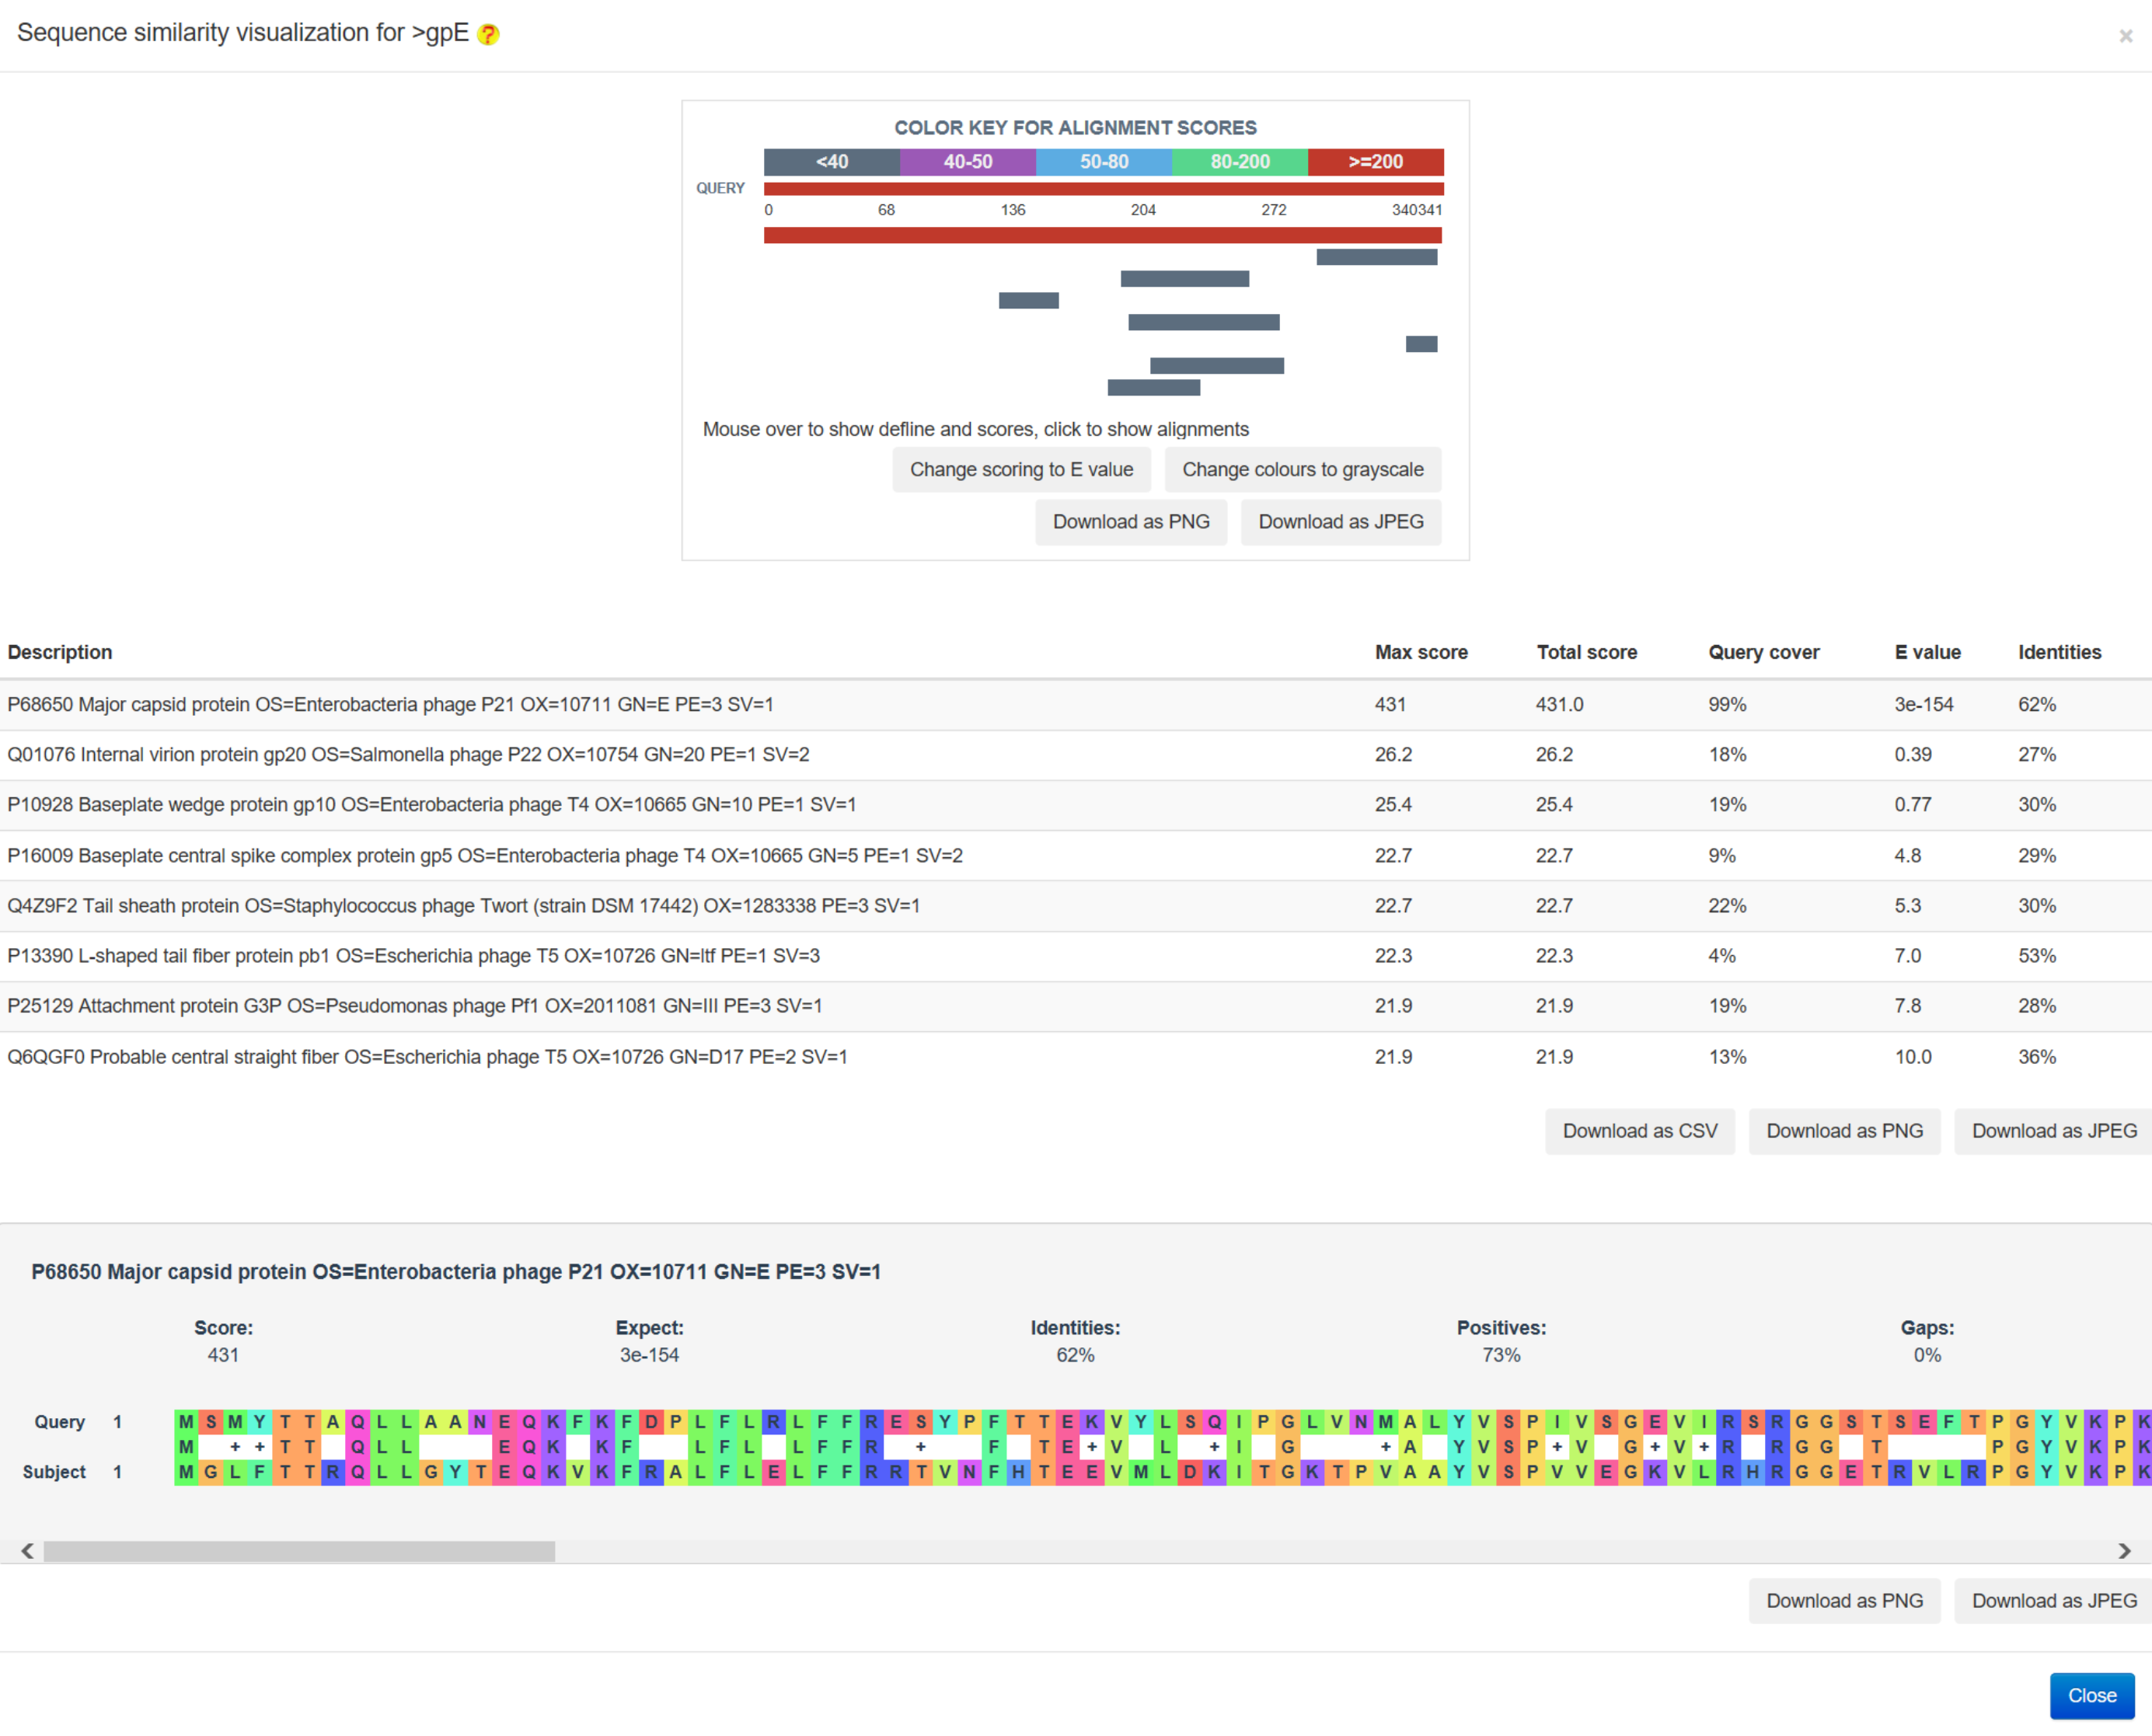
The sequence similarity relationship analysis was conducted by the blast-2.8.1+ program, followed by the visualization using the BLASTERJS library (an example is provided in the following figure)
The phylogenetic relationship analysis was conducted by the multiple sequence alignment program, MAFFT followed by the visualization using the jsPhyloSVG library (an example is provided in the following figure)

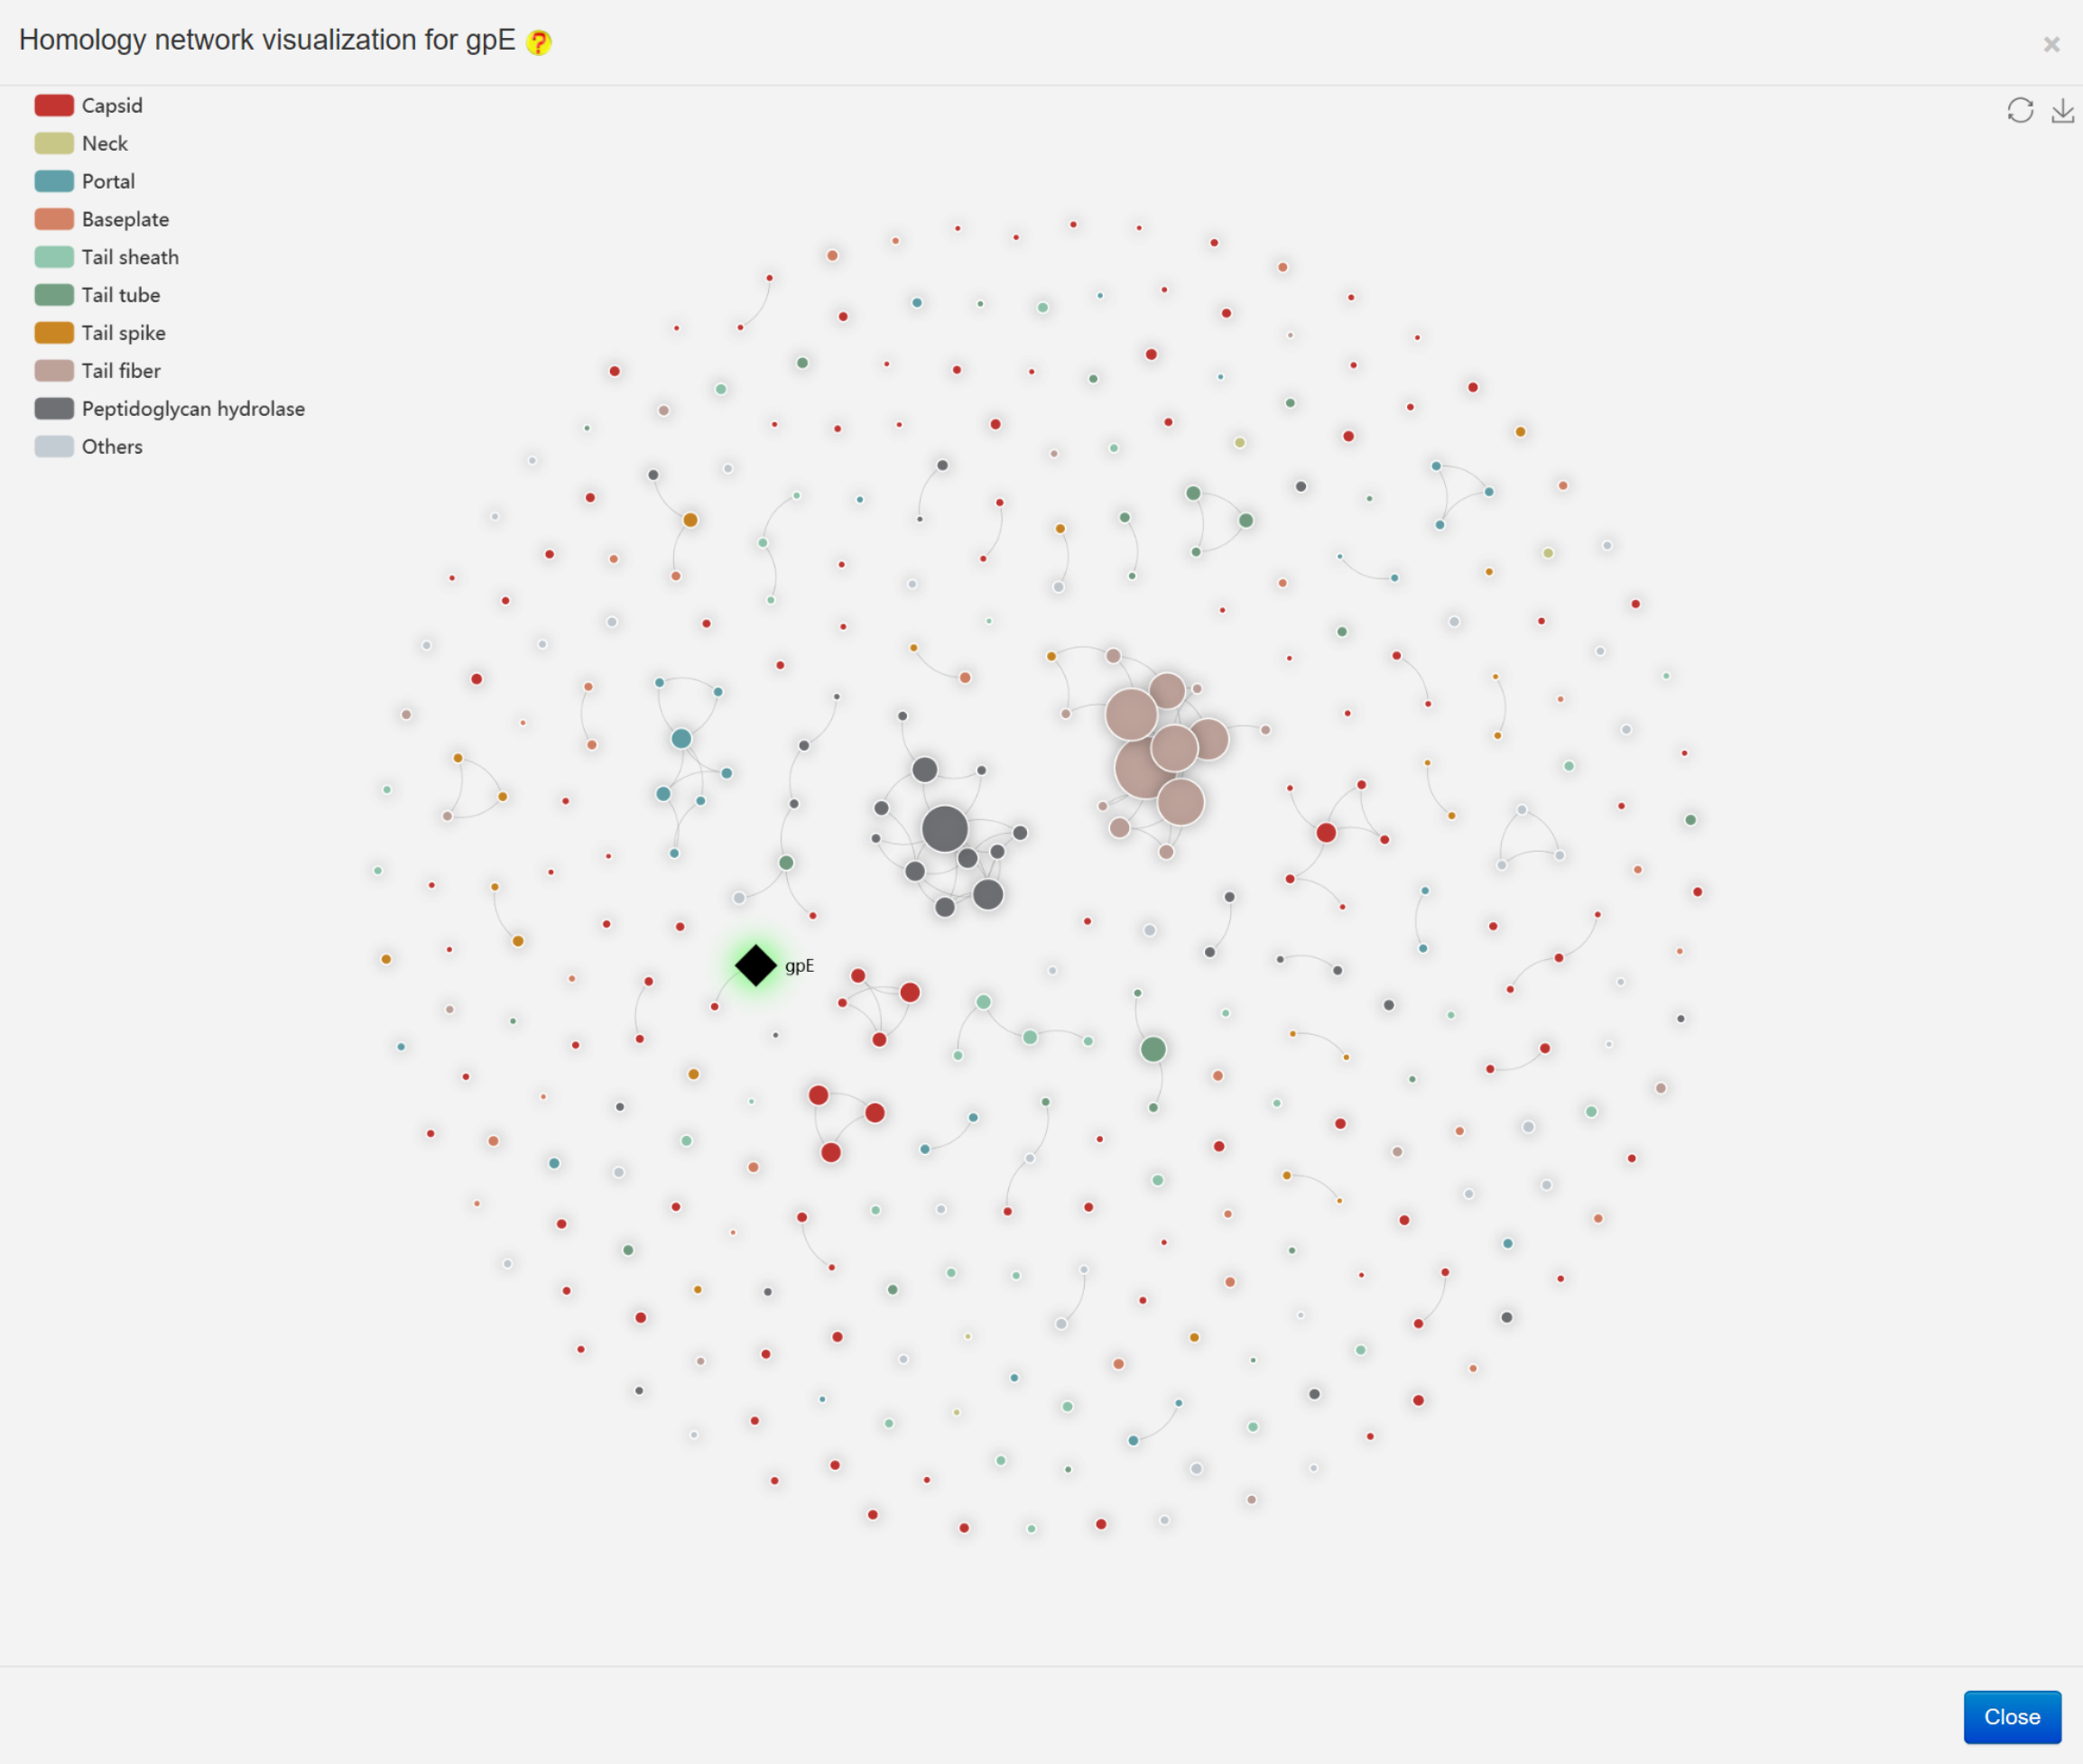
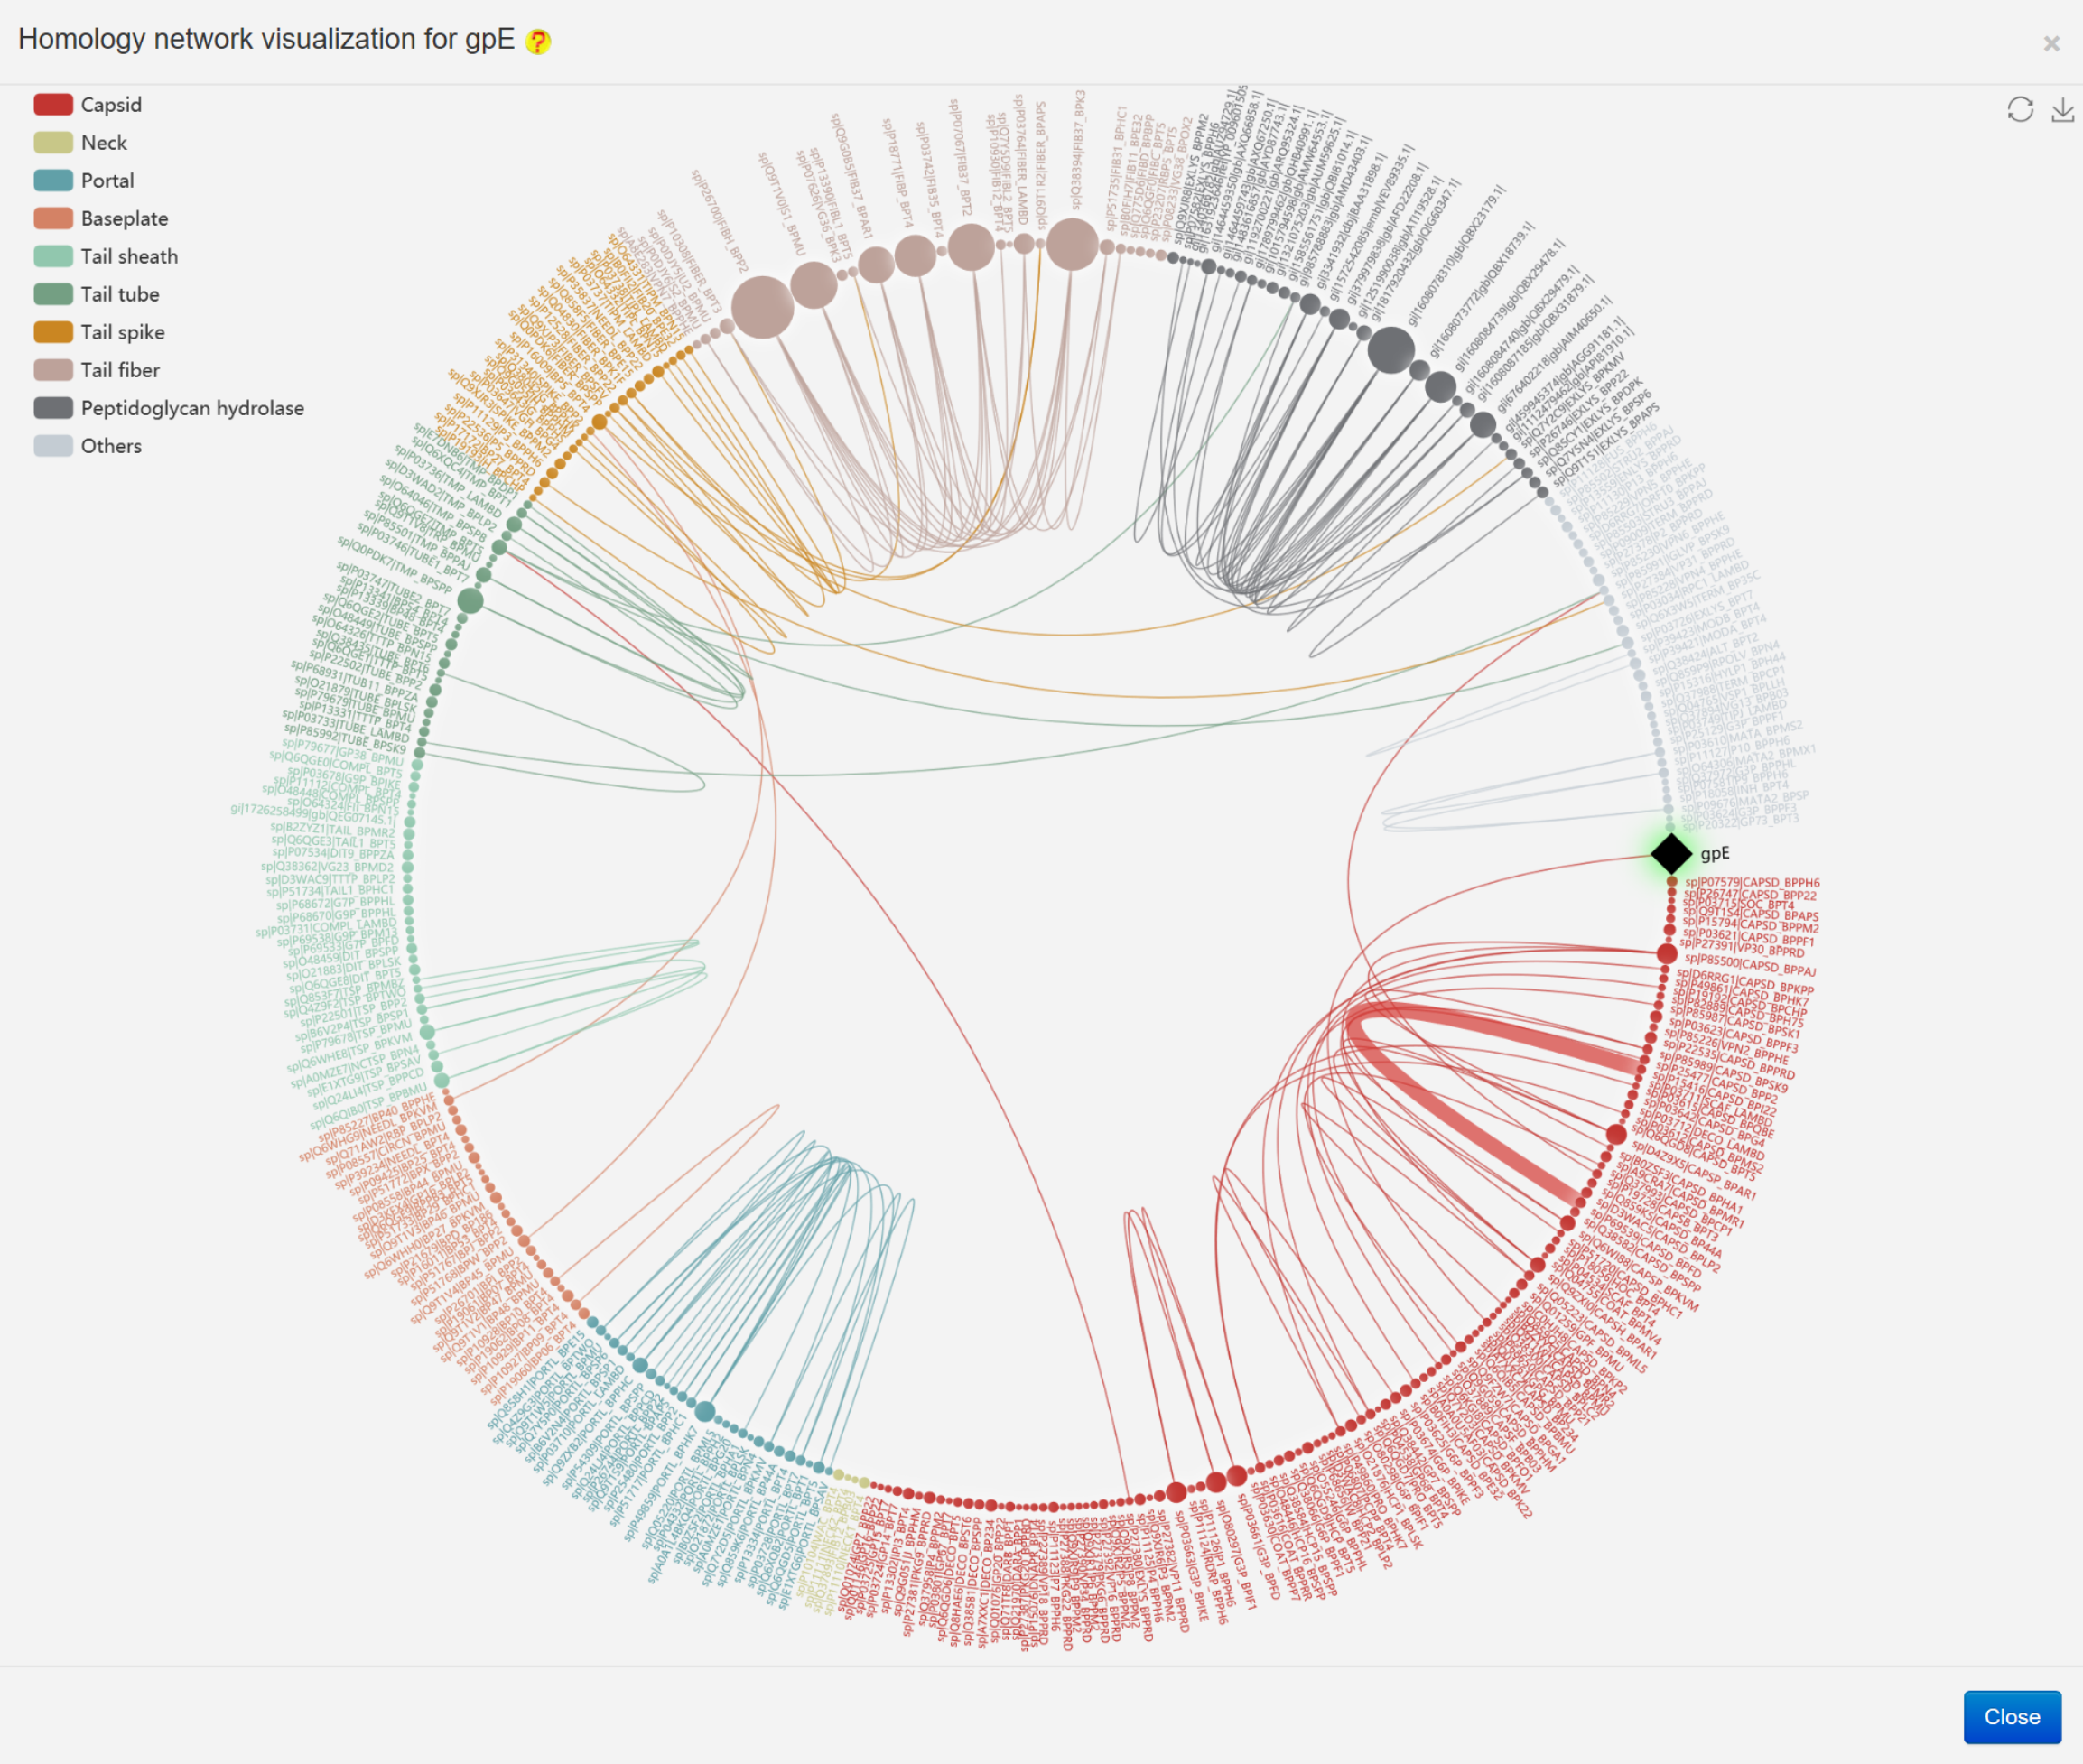
The homology network relationship analysis was conducted by the blast-2.2.26 program, followed by the visualization using the ECharts (an examples is provided in the following figures)